
Page 113 - _21-0619 OK
P. 113
The International Journal of the Royal Society of Thailand
Volume XII, 2020
Owner occupiers Other
Household All Non- Non-farm
groups households Farmers farm low middle Landless 1 Land
income income owners
Farmer 20.1 56.0 42.0 2.0
operators
Other 21.0 18.5 50.0 31.5
proprietors
Employees
Professional, 7.3 4.2 70.0 25.8
technical
Agricultural 4.5 49.0 51.0
workers
Logistics and 5.3 51.4 48.6
other
Sales and 14.6 32.1 20.0 47.9
services
Industrial 11.1 24.6 30.0 43.4 2.0
Inactive 16.0 53.5 30.0 14.5 2.0
Sources: LFS remainder assumed SES Assumed
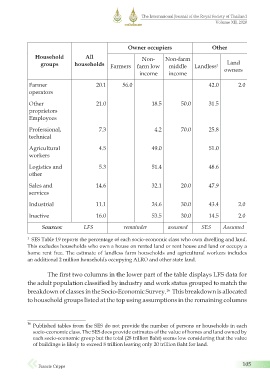
1 SES Table 19 reports the percentage of each socio-economic class who own dwelling and land.
This excludes households who own a house on rented land or rent house and land or occupy a
home rent free. The estimate of landless farm households and agricultural workers includes
an additional 2 million households occupying ALRO and other state land.
The first two columns in the lower part of the table displays LFS data for
the adult population classified by industry and work status grouped to match the
breakdown of classes in the Socio-Economic Survey. This breakdown is allocated
16
to household groups listed at the top using assumptions in the remaining columns
16 Published tables from the SES do not provide the number of persons or households in each
socio-economic class. The SES does provide estimates of the value of homes and land owned by
each socio-economic group but the total (28 trillion Baht) seems low considering that the value
of buildings is likely to exceed 8 trillion leaving only 20 trillion Baht for land.
105
Francis Cripps
_21-0619(085-112)6.indd 105
5/1/2565 BE 09:04
_21-0619(085-112)6.indd 105 5/1/2565 BE 09:04