
Page 109 - _21-0619 OK
P. 109
The International Journal of the Royal Society of Thailand
Volume XII, 2020
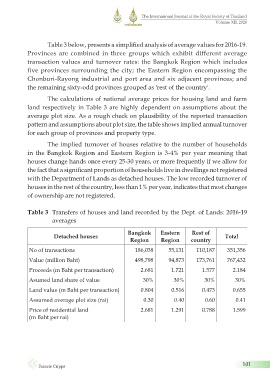
Table 3 below, presents a simplified analysis of average values for 2016-19.
Provinces are combined in three groups which exhibit different average
transaction values and turnover rates: the Bangkok Region which includes
five provinces surrounding the city; the Eastern Region encompassing the
Chonburi-Rayong industrial and port area and six adjacent provinces; and
the remaining sixty-odd provinces grouped as 'rest of the country'.
The calculations of national average prices for housing land and farm
land respectively in Table 3 are highly dependent on assumptions about the
average plot size. As a rough check on plausibility of the reported transaction
pattern and assumptions about plot size, the table shows implied annual turnover
for each group of provinces and property type.
The implied turnover of houses relative to the number of households
in the Bangkok Region and Eastern Region is 3-4% per year meaning that
houses change hands once every 25-30 years, or more frequently if we allow for
the fact that a significant proportion of households live in dwellings not registered
with the Department of Lands as detached houses. The low recorded turnover of
houses in the rest of the country, less than 1% per year, indicates that most changes
of ownership are not registered.
Table 3 Transfers of houses and land recorded by the Dept. of Lands: 2016-19
averages
Bangkok Eastern Rest of
Detached houses Total
Region Region country
No of transactions 186,038 55,131 110,187 351,356
Value (million Baht) 498,798 94,873 173,761 767,432
Proceeds (m Baht per transaction) 2.681 1.721 1.577 2.184
Asumed land share of value 30% 30% 30% 30%
Land value (m Baht per transaction) 0.804 0.516 0.473 0.655
Assumed average plot size (rai) 0.30 0.40 0.60 0.41
Price of residential land 2.681 1.291 0.788 1.599
(m Baht per rai)
101
Francis Cripps
5/1/2565 BE 09:03
_21-0619(085-112)6.indd 101
_21-0619(085-112)6.indd 101 5/1/2565 BE 09:03