
Page 116 - _21-0619 OK
P. 116
The International Journal of the Royal Society of Thailand
Volume XII, 2020
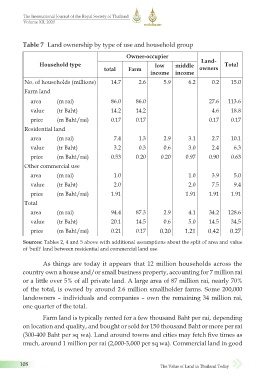
Table 7 Land ownership by type of use and household group
Owner-occupier
Household type low middle Land- Total
total Farm owners
income income
No. of households (millions) 14.7 2.6 5.9 6.2 0.2 15.0
Farm land
area (m rai) 86.0 86.0 27.6 113.6
value (tr Baht) 14.2 14.2 4.6 18.8
price (m Baht/rai) 0.17 0.17 0.17 0.17
Residential land
area (m rai) 7.4 1.3 2.9 3.1 2.7 10.1
value (tr Baht) 3.2 0.3 0.6 3.0 2.4 6.3
price (m Baht/rai) 0.53 0.20 0.20 0.97 0.90 0.63
Other commercial use
area (m rai) 1.0 1.0 3.9 5.0
value (tr Baht) 2.0 2.0 7.5 9.4
price (m Baht/rai) 1.91 1.91 1.91 1.91
Total
area (m rai) 94.4 87.3 2.9 4.1 34.2 128.6
value (tr Baht) 20.1 14.5 0.6 5.0 14.5 34.5
price (m Baht/rai) 0.21 0.17 0.20 1.21 0.42 0.27
Sources: Tables 2, 4 and 5 above with additional assumptions about the split of area and value
of 'built' land between residential and commercial land use
As things are today it appears that 12 million households across the
country own a house and/or small business property, accounting for 7 million rai
or a little over 5% of all private land. A large area of 87 million rai, nearly 70%
of the total, is owned by around 2.6 million smallholder farms. Some 200,000
landowners – individuals and companies – own the remaining 34 million rai,
one quarter of the total.
Farm land is typically rented for a few thousand Baht per rai, depending
on location and quality, and bought or sold for 150 thousand Baht or more per rai
(300-400 Baht per sq wa). Land around towns and cities may fetch five times as
much, around 1 million per rai (2,000-3,000 per sq wa). Commercial land in good
108 The Value of Land in Thailand Today
5/1/2565 BE 09:04
_21-0619(085-112)6.indd 108 5/1/2565 BE 09:04
_21-0619(085-112)6.indd 108