
Page 115 - _21-0619 OK
P. 115
The International Journal of the Royal Society of Thailand
Volume XII, 2020
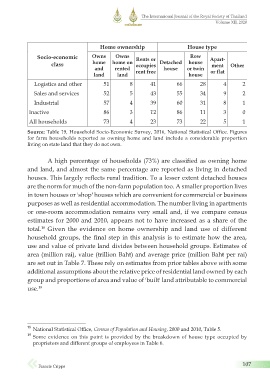
Home ownership House type
Socio-economic Owns Owns Rents or Row Apart-
class home home on occupies Detached house ment Other
and rented house or twin
land land rent free house or flat
Logistics and other 51 8 41 66 28 4 2
Sales and services 52 5 43 55 34 9 2
Industrial 57 4 39 60 31 8 1
Inactive 86 3 12 86 11 3 0
All households 73 4 23 73 22 5 1
Source: Table 19, Household Socio-Economic Survey, 2016, National Statistical Office. Figures
for farm households reported as owning home and land include a considerable proportion
living on state land that they do not own.
A high percentage of households (73%) are classified as owning home
and land, and almost the same percentage are reported as living in detached
houses. This largely reflects rural tradition. To a lesser extent detached houses
are the norm for much of the non-farm population too. A smaller proportion lives
in town houses or 'shop' houses which are convenient for commercial or business
purposes as well as residential accommodation. The number living in apartments
or one-room accommodation remains very small and, if we compare census
estimates for 2000 and 2010, appears not to have increased as a share of the
total. Given the evidence on home ownership and land use of different
18
household groups, the final step in this analysis is to estimate how the area,
use and value of private land divides between household groups. Estimates of
area (million rai), value (trillion Baht) and average price (million Baht per rai)
are set out in Table 7. These rely on estimates from prior tables above with some
additional assumptions about the relative price of residential land owned by each
group and proportions of area and value of 'built' land attributable to commercial
use.
19
18 National Statistical Office, Census of Population and Housing, 2000 and 2010, Table 5.
19 Some evidence on this point is provided by the breakdown of house type occupied by
proprietors and different groups of employees in Table 6.
107
Francis Cripps
5/1/2565 BE 09:04
_21-0619(085-112)6.indd 107
_21-0619(085-112)6.indd 107 5/1/2565 BE 09:04