
Page 100 - _21-0619 OK
P. 100
The International Journal of the Royal Society of Thailand
Volume XII, 2020
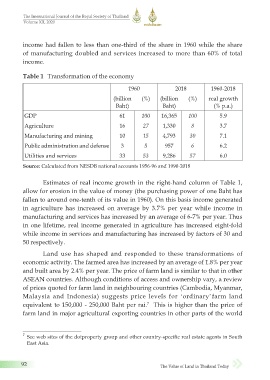
income had fallen to less than one-third of the share in 1960 while the share
of manufacturing doubled and services increased to more than 60% of total
income.
Table 1 Transformation of the economy
1960 2018 1960-2018
(billion (%) (billion (%) real growth
Baht) Baht) (% p.a.)
GDP 61 100 16,365 100 5.9
Agriculture 16 27 1,330 8 3.7
Manufacturing and mining 10 15 4,793 30 7.1
Public administration and defense 3 5 957 6 6.2
Utilities and services 33 53 9,286 57 6.0
Source: Calculated from NESDB national accounts 1956-96 and 1990-2018
Estimates of real income growth in the right-hand column of Table 1,
allow for erosion in the value of money (the purchasing power of one Baht has
fallen to around one-tenth of its value in 1960). On this basis income generated
in agriculture has increased on average by 3.7% per year while income in
manufacturing and services has increased by an average of 6-7% per year. Thus
in one lifetime, real income generated in agriculture has increased eight-fold
while income in services and manufacturing has increased by factors of 30 and
50 respectively.
Land use has shaped and responded to these transformations of
economic activity. The farmed area has increased by an average of 1.8% per year
and built area by 2.4% per year. The price of farm land is similar to that in other
ASEAN countries. Although conditions of access and ownership vary, a review
of prices quoted for farm land in neighbouring countries (Cambodia, Myanmar,
Malaysia and Indonesia) suggests price levels for ‘ordinary̓ farm land
equivalent to 150,000 - 250,000 Baht per rai. This is higher than the price of
7
farm land in major agricultural exporting countries in other parts of the world
7 See web sites of the dotproperty group and other country-specific real estate agents in South
East Asia.
92 The Value of Land in Thailand Today
5/1/2565 BE 09:03
_21-0619(085-112)6.indd 92
_21-0619(085-112)6.indd 92 5/1/2565 BE 09:03